The math behind a SIP is simpler, and more guaranteed, than most explanations make it sound. Investing a fixed rupee amount every month, instead of a fixed number of units, means you automatically buy more units when the price is low and fewer when it is high, and the resulting average cost per unit is mathematically guaranteed to be at or below the simple average of the prices you paid. That is not a market opinion. It is an arithmetic identity, and 2026 handed Indian investors an unusually clean real-world demonstration of it.
The year that made the case for itself
2026 gave the Nifty 50 one of its widest swings in years, which is exactly the kind of year that exposes the difference between the two approaches. The index hit a record closing high of 26,373.20 on 5 January, fell to 22,182.55 by early April, recovered to 24,383.60 by the end of July, then slid again to 22,620.45 by 30 September, a round trip that our Nifty's 2026 round trip piece covers in full.
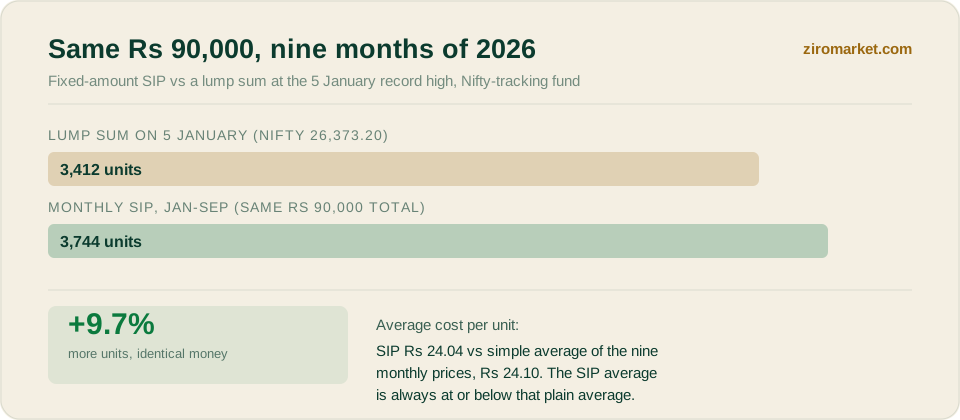
To see the effect in numbers, imagine a simple index fund whose unit price tracks the Nifty at one-thousandth of its level, purely for easy illustration. A fixed Rs 10,000 invested on the same date each month buys a different number of units depending on where the index stood that month.
Add up the units and the SIP investor ends up owning about 3,744 units for Rs 90,000, an average cost of roughly Rs 24.04 per unit. Compare that to the simple arithmetic average of the nine monthly levels, which works out to about Rs 24.10. The SIP's average cost is lower than even the plain average of the prices it bought at, which is the harmonic-mean effect at work: buying more units in the cheap months (March and September) pulls the average down further than buying fewer units in the expensive months (January and July) pulls it up.
Where the math stops being the whole story
This does not mean a SIP beats a lump sum in every market. In a year that rises in a smooth, steady line without a real dip, a lump sum invested on day one wins, because more rupees are compounding for longer and there is no volatility for the averaging effect to exploit. The 2026 example works precisely because the Nifty handed investors two genuine drawdowns to buy into, not because SIPs are structurally superior in all conditions. Our SIP vs lumpsum guide covers that fuller decision, including the Systematic Transfer Plan middle path for a windfall.
What the math does guarantee, always, is the relationship between a fixed-amount purchase schedule and the prices it lands on. Whenever prices move up and down rather than only up, buying a fixed rupee amount at each point produces a lower average cost than buying the same total rupees at any single random point in that same window, including points chosen with no foresight at all. That is also why September 2026's record domestic buying mattered so much, since the SIP flows our DII record buying piece covers were, collectively, doing exactly this kind of averaging at national scale while foreign investors sold.
The discipline is the hard part, not the math. Every one of the nine monthly purchases above required writing a cheque in a month when the news was often bad, including March and September, the two months that happened to lower the average the most. A SIP automates that discipline so it does not depend on an investor's nerve holding up during the exact months the averaging effect needs them to buy.
Choosing a fund to run that SIP in is a separate decision, covered in our how to choose a mutual fund and index funds vs active funds guides, and neither changes the arithmetic above. The averaging effect belongs to the schedule, not to the fund picked to run it in.