Most people freeze at the sight of a balance sheet, but it is telling a story a child could follow: here is what we own, here is what we owe, and here is what is left over. Every balance sheet obeys one unbreakable rule, Assets = Liabilities + Equity, and three checks on it (debt against equity, short-term bills against short-term assets, and whether net worth is growing) tell you most of what you need to judge a company's health in about ten minutes. You do not need an accounting degree, just the right places to look.
A balance sheet is a snapshot on a single date, usually 31 March for Indian companies, not a video of the year. Read alongside the profit and loss statement, it tells you not just whether a company earns money, but whether it is built to last.
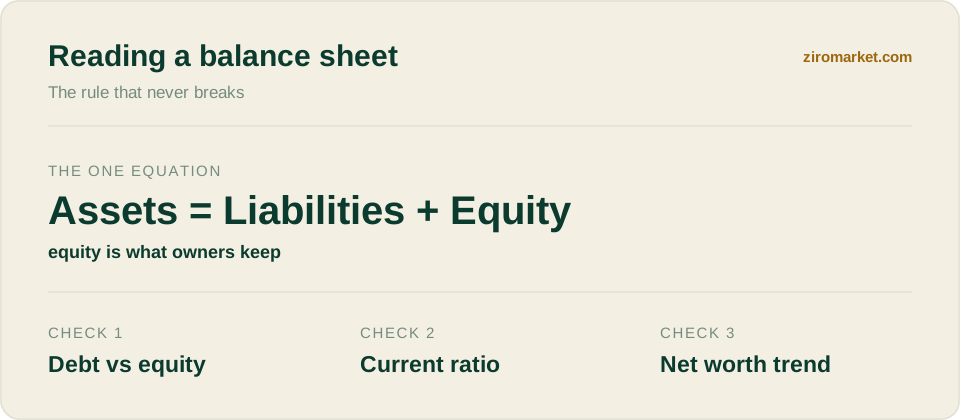
What is the one equation that never breaks?
Everything sits inside a single identity. What a company owns must equal what it owes plus what belongs to its owners, which is why the two sides always balance. Owning a Rs 50 lakh flat funded by a Rs 30 lakh loan and Rs 20 lakh of your own money is the same structure a company uses, only with more zeros.
Indian listed companies present it in a fixed format under Schedule III of the Companies Act, so once you know the layout, every annual report looks familiar. A simplified version looks like this.
The equity of Rs 500 crore is simply assets minus liabilities, the slice that truly belongs to shareholders. That figure is also the company's book value, the foundation of the book value and price-to-book measures.
What does a real one look like?
Two Tata group companies make the point better than any textbook. On 31 March 2026, TCS and Tata Steel had almost the same shareholders' equity, about Rs 1.07 lakh crore and Rs 1.02 lakh crore, yet Tata Steel carried more than eight times the borrowings.
Source: company filings as compiled by Screener.in. TCS's borrowings are largely lease obligations on offices rather than bank loans.

Neither balance sheet is "wrong". A software company's assets are people and contracts that do not appear on the balance sheet, while a steelmaker has to borrow to build furnaces that last decades, which is why you compare a company with its own sector and its own history, never across industries.
Which three checks matter most?
You could spend hours in the footnotes, but three quick reads catch most problems. The first is leverage: divide total borrowings by equity to see how much the company borrows against its own funds. A debt-to-equity ratio under 1 is usually comfortable for a manufacturer, while above 2 flags risk, as our debt-to-equity guide explains with these same two companies.
The second is short-term health. Dividing current assets by current liabilities gives the current ratio, and a figure below 1 means the company may struggle to pay what is due within a year. A business that cannot meet its near-term bills is fragile no matter how profitable it looks on paper.
The third is the trend in equity. TCS's reserves grew about 13% in FY26, from Rs 94,394 crore to Rs 1,06,878 crore, even after paying large dividends, which is what a company compounding value looks like. Pairing this with return on equity tells you how hard that equity is working.
Which red flags should make you look twice?
A few patterns deserve a second read. Receivables growing much faster than sales can mean a company is booking revenue it has not collected, and a sudden jump in "other current assets" with no explanation deserves the notes to accounts. Large contingent liabilities, disclosed in the notes rather than the main statement, can turn into real debt after a court or tax ruling.
Negative net worth is the loudest warning of all, because it means liabilities exceed everything the company owns. Heavy goodwill from past acquisitions is quieter, since it can be written down in a single bad year. Our guide to promoter pledging covers the ownership side of the same question.
The habit that separates good investors from tip-chasers is this: before buying a share, spend ten minutes checking debt, liquidity and the trend in net worth, then cross-read it with valuation measures like the PE ratio. It is not glamorous, but it is how you tell a solid business from a story.