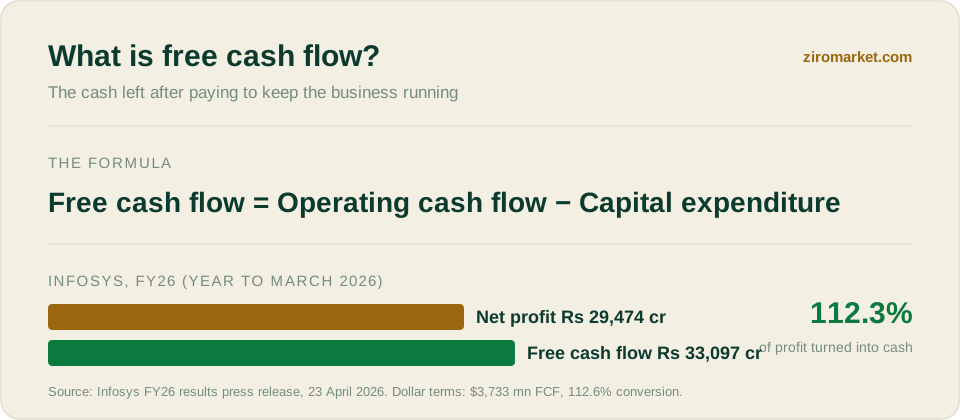
Profit is a number an accountant arrives at, and cash is what is in the bank. The two can drift apart for years, which is why serious investors read both. Free cash flow is the cash a company generates from operations after paying for the equipment, buildings and technology it needs to keep running, so it is what is genuinely left for dividends, buybacks and debt repayment. For FY26, Infosys reported $3,733 million of it.
How do you calculate free cash flow?
The usual formula is operating cash flow minus capital expenditure. Operating cash flow is the first big line of the cash flow statement, the cash the business produced from its day-to-day trade. Capital expenditure is what it spent on fixed assets, which you can trace through the balance sheet. Companies define the figure with small differences, so always check how the company you are reading builds its own number.
Why does free cash flow tell you more than profit?
Profit includes things that never touch the bank, such as depreciation, provisions and revenue booked before the customer pays. A business can show rising profit while its cash quietly drains, and free cash flow is the line that exposes it. Read together, the two numbers give four different stories.
How did Infosys turn Rs 29,474 crore of profit into Rs 33,097 crore of cash?
Infosys sells people's time, not factories. An asset-light business like that spends little on plants and collects from large clients on a steady rhythm, so more than 100% of profit can arrive as cash. In the year to March 2026 its free cash flow was 112.6% of net profit in dollar terms and 112.3% in rupees, on revenue of $20,158 million.

The cash then went back to owners. Infosys said it returned over Rs 37,500 crore to shareholders for FY26 through a final dividend of Rs 25 per share, its interim dividend and a buyback, which is more than the year's free cash flow. That is the practical reason investors watch this line, because it caps how much a company can pay out without drawing on reserves. For the mechanics of the payout side, see how buybacks work in India and what dividend yield tells you.
How is free cash flow different from EBITDA?
EBITDA adds depreciation back to profit, so it never shows the cost of replacing worn-out assets. Free cash flow deducts the real spending on those assets, which is why a company can post a large EBITDA and still have little free cash flow. Steel makers, telecom firms and airlines are the usual examples, because their plants, networks and aircraft need constant spending to stay in service.
A related measure is free cash flow yield, which is free cash flow divided by market capitalisation. It shows how much cash the business generates for each rupee an investor pays for the whole company, so it can be set beside the dividend yield to see whether payouts are covered by what the business actually produces.
Where can free cash flow mislead?
A single quarter or a single year can mislead, because capital spending and customer payments arrive in lumps. Infosys's own fourth-quarter conversion was 90.6%, well below the 112.6% for the full year, with $833 million of free cash flow in the quarter. Look at three to five years instead.
Negative free cash flow is not automatically bad either. A company building factories or data centres can run negative for years and still create value if those assets later earn a strong return on capital employed. The warning sign is negative free cash flow in a mature business that is not growing. Companies can also flatter the number for a while by postponing maintenance spending or stretching payments to suppliers, so a strong year deserves a look at what changed.
The cleanest habit is to ask whether the cash is growing as fast as the profit, which means reading free cash flow next to earnings per share every time.